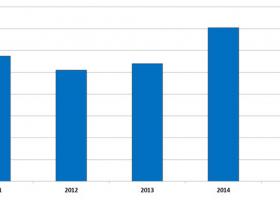
Waterfront and residential non-waterfront sales running at average levels in October 2017
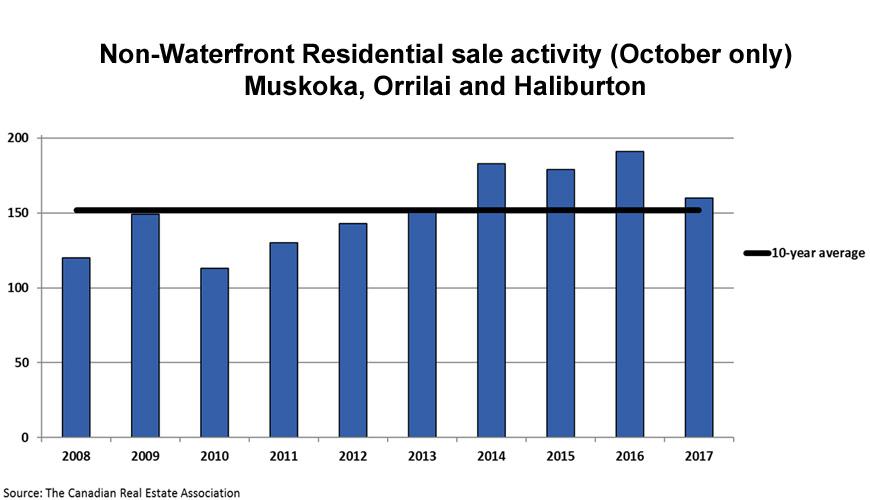
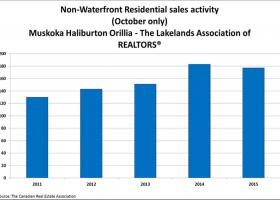
Residential non-waterfront sales activity recorded through the MLS® system of Muskoka Haliburton Orillia – The Lakelands Association of REALTORS® numbered 160 units in October 2017. This was down 16.2% from last October’s 14-year high for the month.
On a year-to-date basis, residential non-waterfront sales were running just 1.9% below the first 10 months of 2016 but remained above all other years on record.
Sales of waterfront properties came in 11.3% below last October. On a year-to-date basis, waterfront sales were down 14.2% from the first 10 months of 2016.
Both the waterfront and non-waterfront sales figures for October 2017 stood in between the five and 10-year averages for the month of October.
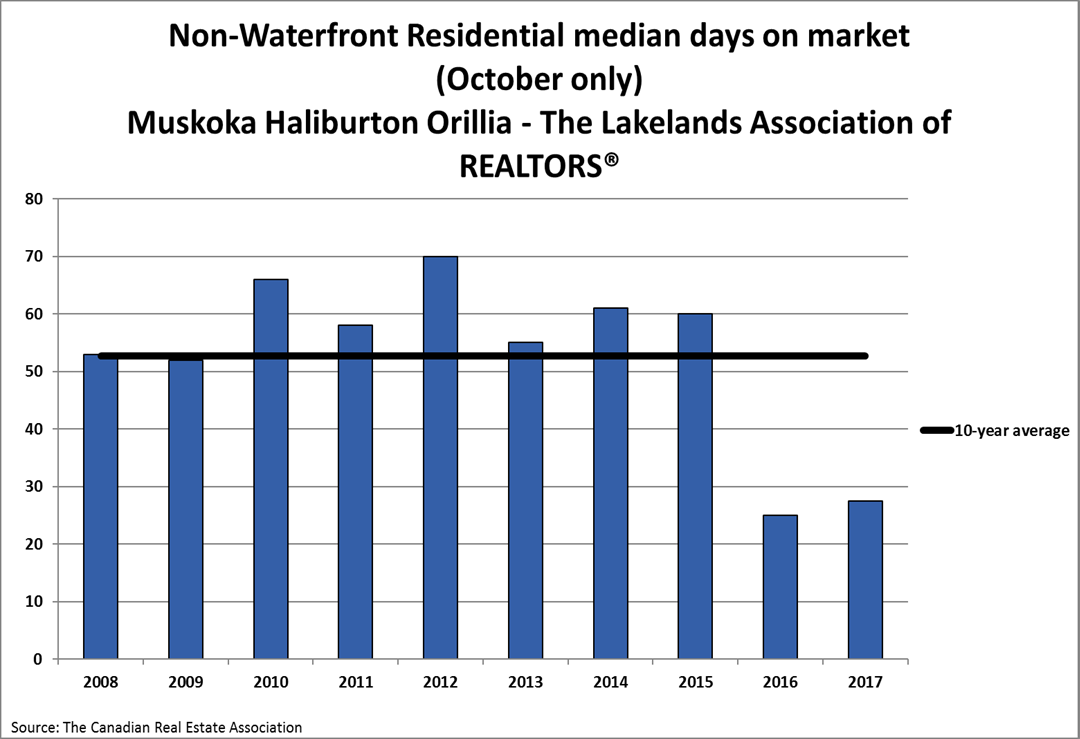
"Sales are now back at more average levels compared to the record and near-record levels that prevailed right up until this spring," said Mike Stahls, President of Muskoka Haliburton Orillia – The Lakelands Association of REALTORS®. "Sales activity is starting to recover from a quiet summer in many Greater Golden Horseshoe markets, suggesting buyers are beginning to come back off the sidelines. Activity in the final months of the year might also get a boost from buyers advancing purchases in advance of tougher mortgage qualification rules which come into force in the New Year."
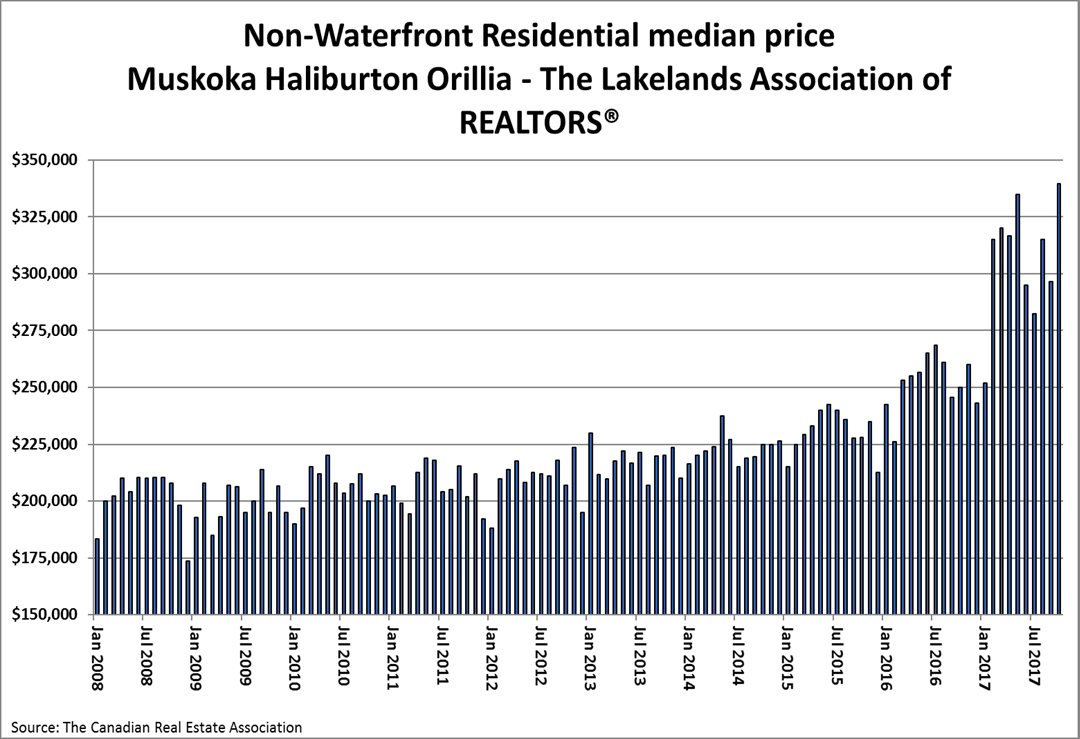
The median price for residential non-waterfront property sales was a record $339,450 in October 2017, an increase of 35.8% from October 2016.
The median price for waterfront sales was $478,000 in October 2017, rising 12.5% from October 2016.
The dollar value of all residential non-waterfront sales in October 2017 totaled $55.9 million, rising 9% from October 2016. This was the highest October level on record.
The total value of waterfront sales was $95.4 million, down 5.6% from October 2016.
| Summary – Sales by Housing Type | |||
|---|---|---|---|
| Category | October 2017 | October 2016 | Year-over-year percentage change |
| Non-Waterfront Residential | 160 | 191 | -16.2 |
| Waterfront | 125 | 141 | -11.3 |
| Includes transactions in all areas recorded by Muskoka Haliburton Orillia – The Lakelands Association of REALTORS® | |||
| Summary – Median Price by Housing Type | |||
|---|---|---|---|
| Category | October 2017 | October 2016 | Year-over-year percentage change |
| Non-Waterfront Residential | $339,450 | $250,000 | 35.8 |
| Waterfront | $478,000 | $425,000 | 12.5 |
| Includes transactions in all areas recorded by Muskoka Haliburton Orillia – The Lakelands Association of REALTORS® | |||
| Detailed – Non-Waterfront Residential Sales and Median Price by Area | ||||||
|---|---|---|---|---|---|---|
| Non-Waterfront Residential | ||||||
| By Area | Unit Sales | Median Sale Price | ||||
| October 2017 | October 2016 | Year-over-year percentage change | October 2017 | October 2016 | Year-over-year percentage change | |
| Muskoka | 78 | 108 | -27.8 | $309,950 | $231,500 | 33.9 |
| Haliburton | 7 | 13 | -46.2 | $289,000 | $210,000 | 37.6 |
| Orillia | 73 | 62 | 17.7 | $390,000 | $283,250 | 37.7 |
| All Other Areas | 2 | 8 | -75.0 | $339,000 | $377,000 | -10.1 |
| Note: A percentage change of -- indicates there were no sales in the same month one year ago. | ||||||
| Detailed – Waterfront Sales and Median Price by Area | ||||||
|---|---|---|---|---|---|---|
| Waterfront | ||||||
| By Area | Unit Sales | Median Sale Price | ||||
| October 2017 | October 2016 | Year-over-year percentage change | October 2017 | October 2016 | Year-over-year percentage change | |
| Muskoka | 81 | 87 | -6.9 | $480,000 | $535,000 | -10.3 |
| Haliburton | 34 | 38 | -10.5 | $405,750 | $373,500 | 8.6 |
| Orillia | 10 | 14 | -28.6 | $639,950 | $440,000 | 45.4 |
| All Other Areas | 0 | 2 | -100.0 | $0 | $324,250 | -100.0 |
| Note: A percentage change of -- indicates there were no sales in the same month one year ago. | ||||||
The information contained in this report has been prepared by The Canadian Real Estate Association, in co-operation with Muskoka Haliburton Orillia – The Lakelands Association of REALTORS®