Waterfront sales set new October record
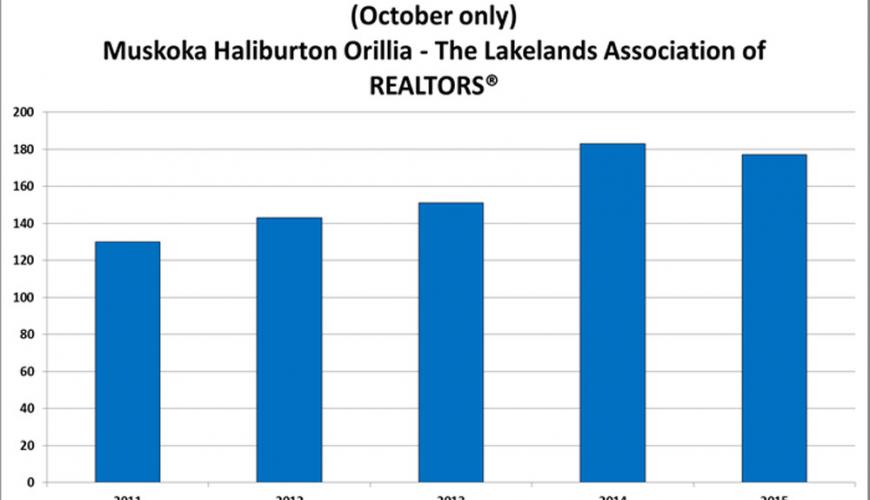
Residential non-waterfront sales activity recorded through the MLS® system of Muskoka Haliburton Orillia – The Lakelands Association of REALTORS® numbered 177 units in October 2015, down 3.3 per cent from October 2014. That said, this is still historically quite strong, standing well above both the five and 10-year averages for the month.
On a year-to-date basis residential non-waterfront property sales were running 3.6 per cent above levels at the same time last year. With activity numbering 1,661 units sold, this was the best sales figure for the period since 2003.
Sales of waterfront properties rose 10.2 per cent from last October to reach a record 162 units in October 2015. Year-to-date sales of waterfront properties (1,437 sales) were running 13.2 per cent ahead of the same period in 2014, marking the best first 10 months of any year on record.
“Non-waterfront sales stepped back a bit on a year-over-year basis in October, although looking further back in history it was still the second best showing for the month in eight years,” said Tom Wilkinson, President of Muskoka Haliburton Orillia – The Lakelands Association of REALTORS®. “Meanwhile, for the fourth time in the past five months sales of waterfront properties set a new monthly record. At this point, with just two months left to go in 2015, a new annual record for waterfront property sales this year is pretty much a given.”
The median price for residential non-waterfront property sales was $228,500 in October 2015, up 1.6 per cent from October 2014.
The median price for waterfront sales was $376,000 in October 2015, down 4.8 per cent from October 2014.
The dollar value of all residential non-waterfront sales in October 2015 totalled $43 million, edging down 0.6 per cent from October 2014. However, this was still the second best level for the month on record.
The total value of waterfront sales was $84.8 million, up 4.4 per cent from October last year. This was the best October on record.
Summary – Sales by Housing Type | |||
|---|---|---|---|
| Category | October 2015 | October 2014 | Year-over-year percentage change |
| Non-Waterfront Residential | 177 | 183 | -3.3 |
| Waterfront | 162 | 147 | 10.2 |
| Includes transactions in all areas recorded by the REALTORS® Association of Ontario Lakelands | |||
Summary – Median Price by Housing Type | |||
|---|---|---|---|
| Category | October 2015 | October 2014 | Year-over-year percentage change |
| Non-Waterfront Residential | $228,500 | $225,000 | 1.6 |
| Waterfront | $376,000 | $395,000 | -4.8 |
| Includes transactions in all areas recorded by the REALTORS® Association of Ontario Lakelands | |||
Detailed – Non-Waterfront Residential Sales and Median Price by Area | ||||||
|---|---|---|---|---|---|---|
Non-Waterfront Residential | ||||||
| By Area | Unit Sales | Median Sale Price | ||||
| October 2015 | October 2014 | Year-over-year percentage change | October 2015 | October 2014 | Year-over-year percentage change | |
| Muskoka | 90 | 93 | -3.2 | $224,250 | $222,500 | 0.8 |
| Haliburton | 19 | 17 | 11.8 | $182,500 | $207,500 | -12.0 |
| Orillia | 64 | 78 | -17.9 | $240,000 | $238,500 | 0.6 |
Detailed – Waterfront Sales and Median Price by Area | ||||||
|---|---|---|---|---|---|---|
Waterfront | ||||||
| By Area | Unit Sales | Median Sale Price | ||||
| October 2015 | October 2014 | Year-over-year percentage change | October 2015 | October 2014 | Year-over-year percentage change | |
| Muskoka | 100 | 88 | 13.6 | $420,000 | $426,000 | -1.4 |
| Haliburton | 43 | 36 | 19.4 | $328,000 | $335,000 | -2.1 |
| Orillia | 15 | 31 | -51.6 | $370,000 | $439,000 | -15.7 |